How DMCS is supporting secure operations with a logging framework that can be extended to support special client requirements
Description of logs in DMCS
In DMCS we apply two approaches to logs in our running system. One is targeted mainly at technical analysis, whereas we log user access using a normal and - if desired by our clients - an extended approach.
Technical logging: Activity in the containers are logged to a varying degree, based on the complexity and need for technical analysis. These logs are managed by docker and are purged when restarting the container.
Security logging: All user activities in the toolbox (our web interface) is logged and stored on the server for possible analysis in persistent .log files. In our normal approach this is managed in our user logs. This is the granularity required for most. If desired we can provide an extra service with more detail and the opportunity to send logs to third-party tools that the client may use.
All data needed for the functioning of the DMCS are stored mainly in elasticsearch and partly in postgres. This data can be analysed forensically through the toolbox's analytical features and the Kibana installation. This ongoing maintenance of state in the system is not considered logging.
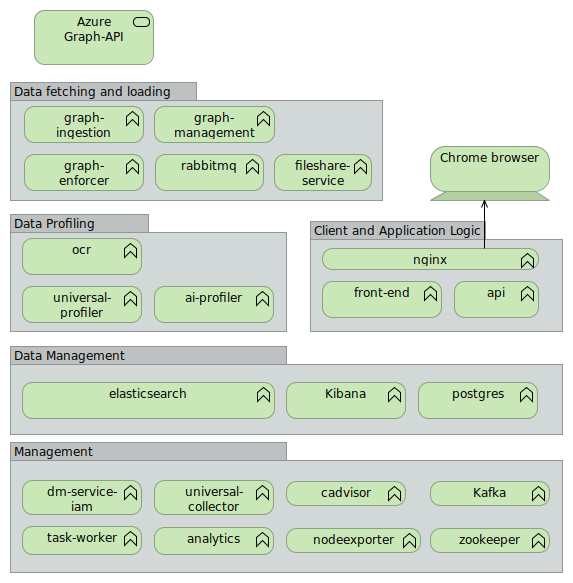
The following diagram overviews the components running on each DMCS server. Some of our servers host multiple clients, but most servers host one client.
Logging Architecture
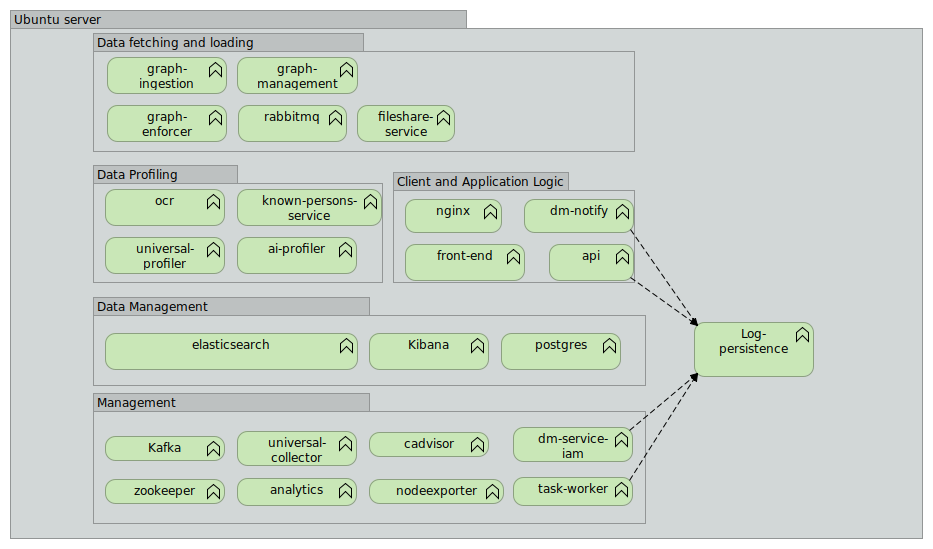
Our default logging architecture does the following:
The containers that are important for capturing user and security activity are all logged to the server file system and can be picked up by a logging agent depending on the desired logging architecture.
Other containers where logging is mainly for debugging purposes are just managed in the container and follows the life cycle of the container.
If so desired, the system can be configured to add persistence to other logs than the ones proposed in the standard configuration. The api container logs all user activity on the toolbox so this is the place to analyse specific user activity. Logins are all captured in dm-service-iam.
In the default configuration, a user-log is capturing key user actions. The user log is a simplified version of the api log, which captures key user events. These are written to the file system on the server for further processing.
For more detailed capturing of logs, the Docker containers have a number of available drivers
for logging (see full list) that can be configured for each container in the docker-compose file:
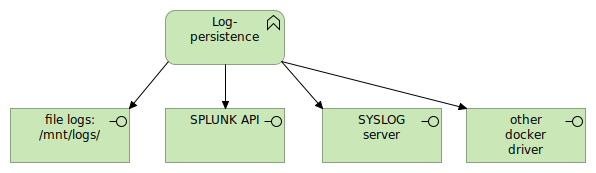
For our normal service, we provide user log persistence and we monitor logs for operational and security reasons.
If our clients have extended needs for log monitoring, we can provide other log configurations, where our clients or third-parties provide log capture such as e.g. Splunk or SYSLOG. We then configure the relevant docker containers to log to the desired log capture endpoint provided by the client.
User log files
Records of actions performed by users, like edits, data queries, configuration changes, or any other interactions with the system's features and functionalities.
file format
Log name: logs-YYYY-MM-DD.log | Location:/mnt/docker/volumes/logs/_data/[Company ID] | Format: comma separated ascii file (type value pairs) |
External access to user logs:
User logs can be forwarded to an external logging endpoint in real-time.
Endpoint URL and token needs to be sent to support@dataandmore.com to setup the external logging.
The client needs to allow traffic from our server to the API endpoint. Data&More support will provide the ip-address or range that should be allowed.